 BAM GeoPortal
Boosted Regression Trees
Type of resources
Topics
Keywords
Contact for the resource
Provided by
Formats
Representation types
Update frequencies
status
Scale
Regions
Categories
-

Maps representing near-national waterfowl density and abundance of 13 individual species and 4 species groups (goldeneyes, mergansers, scoters, and scaup). Predictive models were built using Boosted Regression Tree analysis, data from the Waterfowl Breeding Population and Habitat Survey, and several environmental datasets. Methods used to create 17 species-level models are described in Barker et al. 2014 (ACE 9(2): 7). Guild-Level Maps (cavity nesters, ground nesters, and overwater Nesters) were produced by summing species-level observations and then built models at the guild level. The prediction of total waterfowl abundance was produced by summing the predictions from guild-level models (cavity nesters, ground nesters, and overwater nesters). Species specific model uncertainty are also provided.
-

Species specific mean projections and uncertainty estimates (coefficient of variation) of80 boreal-breeding songbird species generated using boosted regression tree models for the current period (based on climate data from 1961-1990) and three future time periods (2011–2040, 2041–2070, 2071–2100).
-
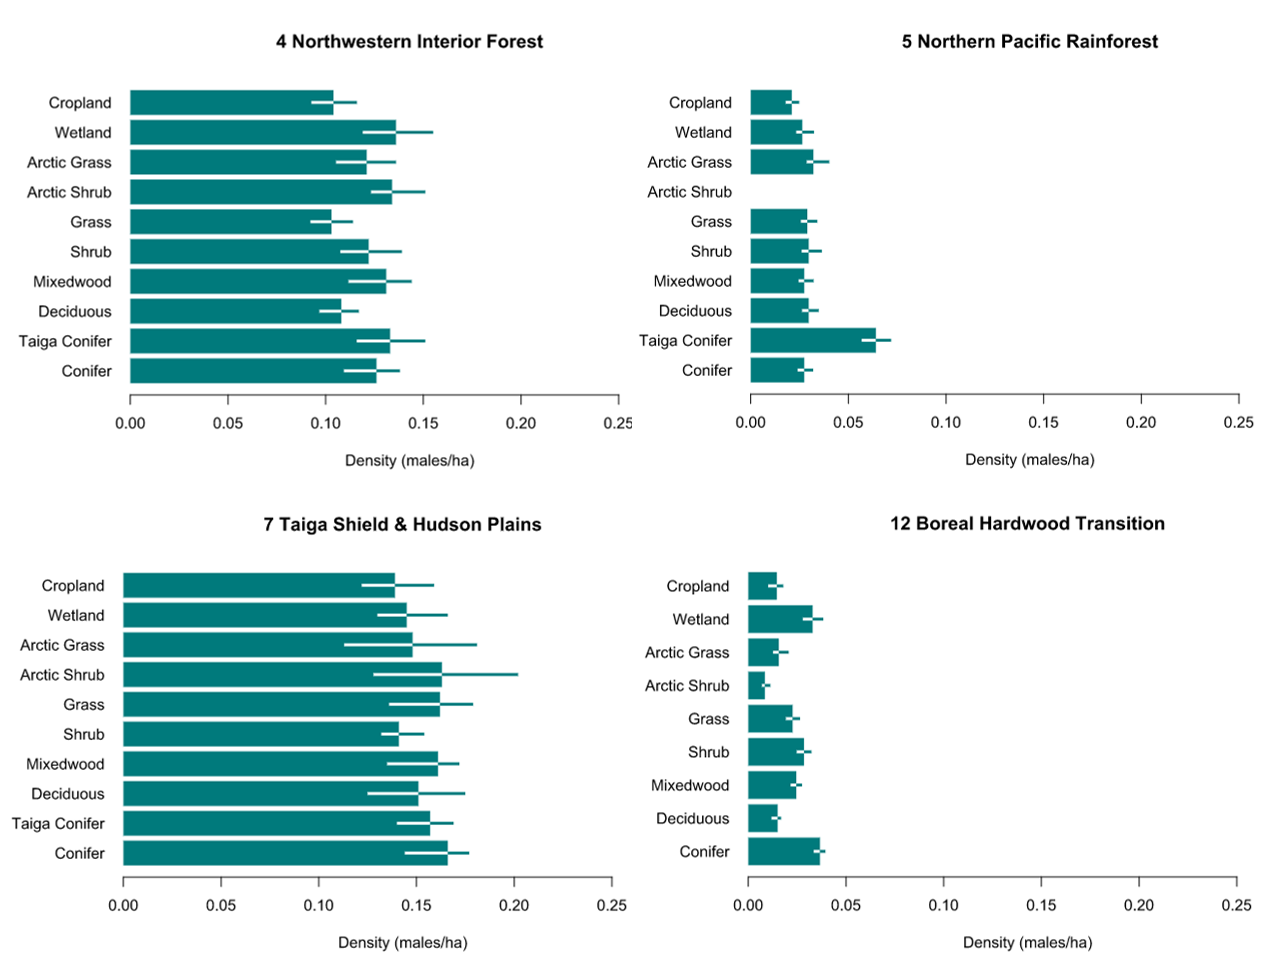
Tables representing species specific mean density(males/ha) by region and landcover classes. Models for each bird conservation regions (BCRs) intersecting Canadian jurisdictional boundaries were based on covariates such as tree species biomass (local and landscape scale), forest age, topography, land use, and climate. We used a post-hoc stratification (‘post-stratification’) approach to estimate land cover based density estimates (males per ha) for each species and regions (Canada and subunits). We classified the predictive maps according to the 2005 MODIS-based North American landcover map into major land cover types (Conifer, Taiga Conifer, Deciduous, Mixedwood, Shrub, Grass, Arctic Shrub, Arctic Grass, Wetland, Cropland) and calculated the mean of the pixel level predicted densities. Uncertainty was based on the 5th and 95th percentiles of the bootstrap distribution.
-
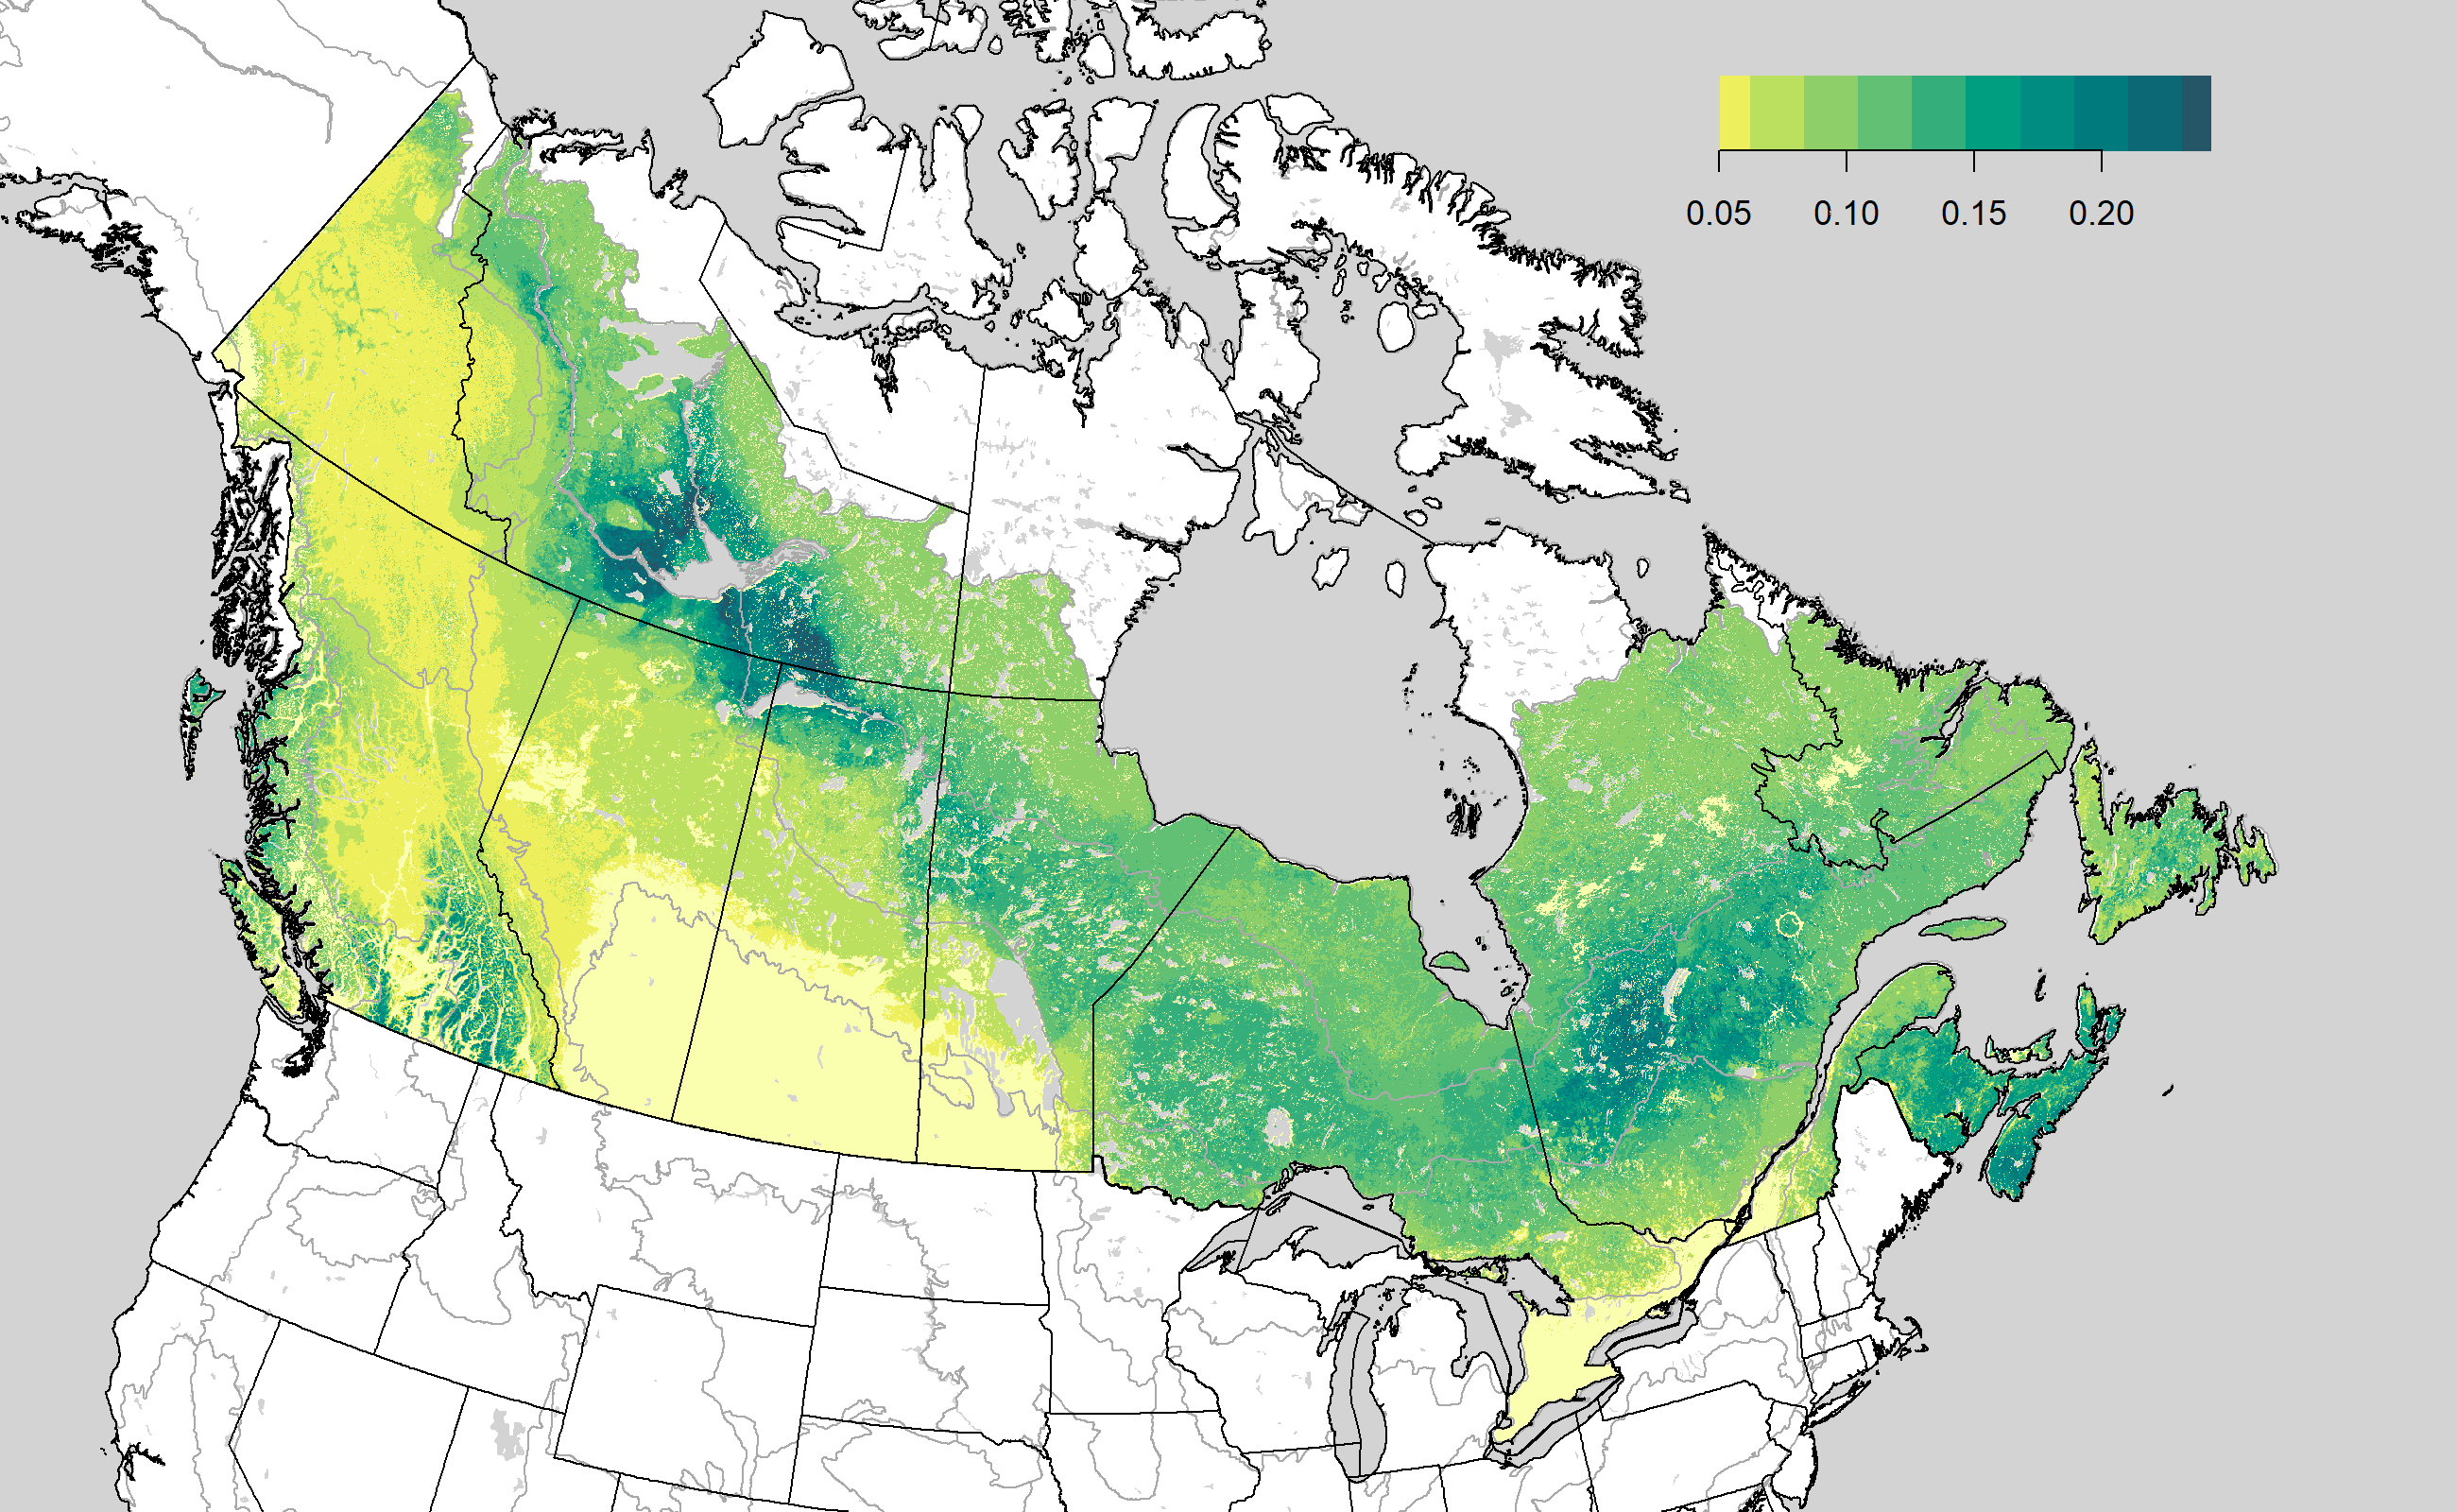
Maps of density (males/ha) in relation to environmental covariates, using the Boreal Avian Modelling Project database of point-count surveys.